Heat Map Deviation
Instantly visualize deviations and warpage with intuitive, color-coded 3D heat maps. Green indicates the surface is within tolerance, while red and blue indicate excess material or undercut conditions.
Verify manufactured components against original CAD models using advanced 3D scanning and deviation analysis. Accelerate your First Article Inspection (FAI) and eliminate manufacturing defects before they compound.
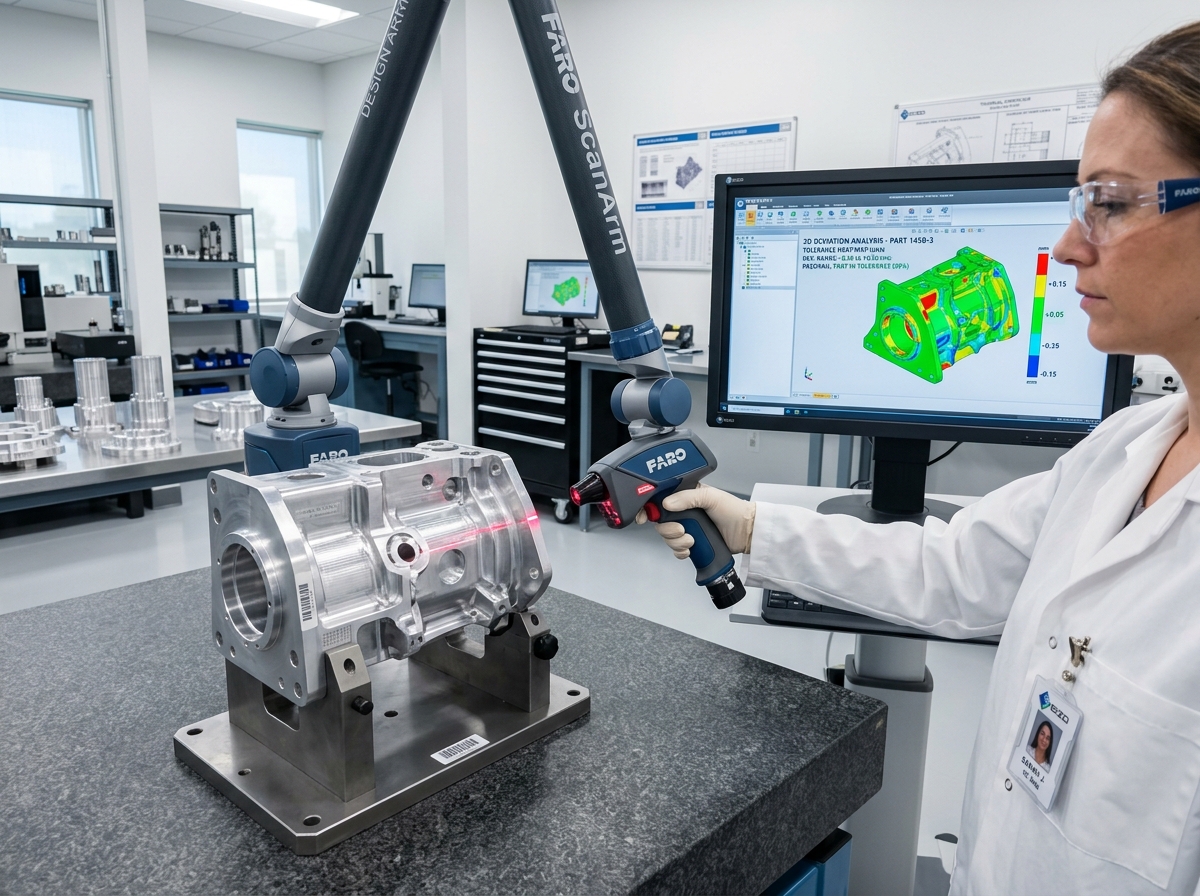
3D Quality Inspection, or Computer-Aided Inspection (CAI), replaces slow manual CMM measurements with high-speed full-part scanning. By capturing millions of surface data points, we can digitally overlay the manufactured physical part onto its original nominal CAD design. This instantly highlights shrinkage, warpage, and machining errors across the entire surface of the part, rather than just isolated touch-points.
We provide highly visual, actionable data reports. Our metrology analytics are generated using industry-leading software like Geomagic Control X and PolyWorks.
Instantly visualize deviations and warpage with intuitive, color-coded 3D heat maps. Green indicates the surface is within tolerance, while red and blue indicate excess material or undercut conditions.
Ensure critical dimensions, hole positions, cylinder concentricity, and surface flatness meet strict Geometric Dimensioning and Tolerancing (GD&T) requirements.
Comprehensive, multi-page PDF reports containing 2D cross-sections, whisker diagrams, and tabular data for seamless integration into your Quality Assurance documentation.
The manufactured component is digitized using high-precision structured light or laser metrology scanners, capturing millions of points across complex geometries in minutes.
The resulting 3D scan data (mesh) is imported into inspection software and mathematically aligned (Best Fit, Datum, or RPS alignment) over the nominal CAD model.
The software calculates the exact deviation of every single scanned point against the CAD surface. Specific GD&T callouts (flatness, cylindricity) are applied to critical features.
Customized inspection reports are automatically generated, highlighting PASS/FAIL criteria to accelerate the First Article Inspection pipeline.
Scanning the first run of plastic parts to detect warping and shrinkage, allowing tooling engineers to adjust the mold cavity before mass production begins.
Verifying that complex metal castings in the automotive sector have sufficient machining allowance (material stock) before they are sent to the CNC mills.
Scanning turbine blades and mining crusher wear-liners periodically over their lifecycle to analyze volume loss and predict maintenance intervals.
We deliver registered point cloud data in .RCP, .E57, and .LAS formats (100% compatible with Autodesk Revit, AutoCAD, Navisworks, and ArchiCAD), as well as native 3D .RVT BIM models (LOD 200–500) and 2D/3D .DWG CAD drawings ready for immediate design workflows.
Our high-definition terrestrial LiDAR scanners achieve sub-millimeter to ±2mm spatial accuracy. This millimeter precision allows engineering and architectural teams in South Africa to pre-detect clashes and eliminate costly site rework before fabrication or construction begins.
A Point Cloud is a raw 3D digital measurement map composed of millions of laser points (.RCP/.E57). Scan-to-BIM converts that raw point cloud into an intelligent, parametric 3D Revit model (.RVT) containing smart building objects like structural beams, walls, pipes, and MEP systems for architectural design and facility management.
Our localized survey teams in South Africa can mobilize within 24 to 48 hours of project approval. On-site scanning is up to 75% faster than manual surveying (typically 1 to 2 days on site), and registered point clouds or 3D BIM models are delivered within 3 to 5 business days.
Yes. Non-contact terrestrial laser scanning operates safely from a distance without touching equipment or disrupting plant operations. Our field surveyors hold safety certifications and medical clearances to operate on active construction sites, chemical plants, and underground mines across South Africa.
Pricing is based on site square footage/acreage, spatial complexity (e.g., commercial building vs. complex industrial MEP plant), and requested deliverable type (raw point cloud vs. LOD 300–500 BIM model). You can request an instant indicative cost estimate via our online estimator tool.
Get an instant price estimate for millimeter-accurate point cloud data, Scan-to-BIM Revit modeling, and 3D reality capture across South Africa.
Trusted by Top AEC & Mining Firms Across South Africa